
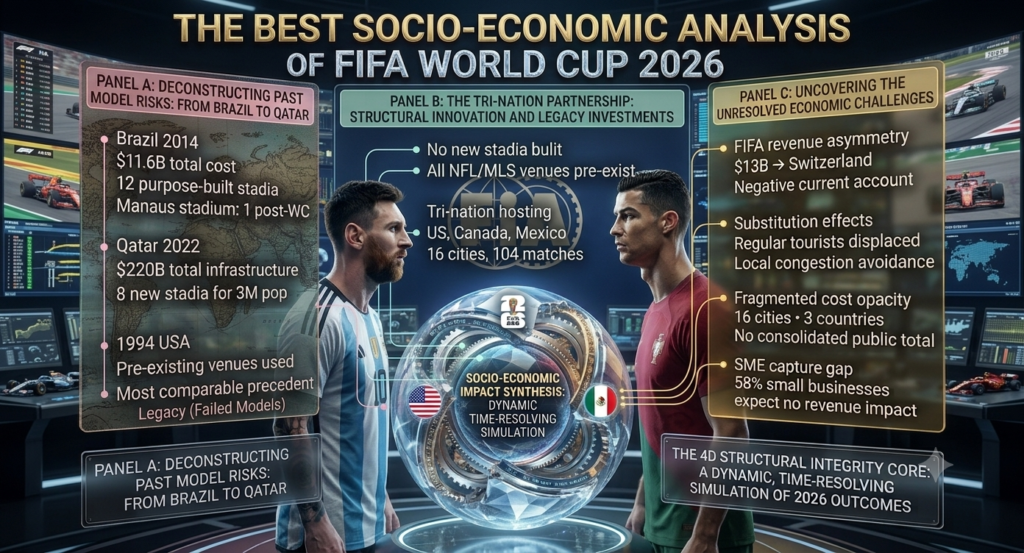
A Comparative Analysis of Projected Revenues, Public Cost Distribution, and Net Community Benefit Across Sixteen Host Cities in North America
Abstract
The 2026 FIFA World Cup represents the largest restructuring in the tournament’s 96-year history expanding from 32 to 48 national teams, 64 to 104 matches, and a single host nation to a continental tri-nation format spanning 16 cities across the United States, Canada, and Mexico. Its promotional economic narrative projects $40.9 billion in additional global GDP and a $9.1 billion tourism boost across North America. Against this backdrop, this paper critically evaluates the gap between aggregate projection and distributional reality: who captures the financial gains, who bears the public costs, what the verified early data shows, and how the 2026 model compares structurally to the white-elephant legacies of Brazil 2014 and Qatar 2022. We find that while the pre-existing infrastructure model substantially reduces the tournament’s worst fiscal risks, the fundamental asymmetry between FIFA’s revenue capture and host-city taxpayer exposure remains structurally unresolved.
1. Introduction: A Tournament Designed Differently
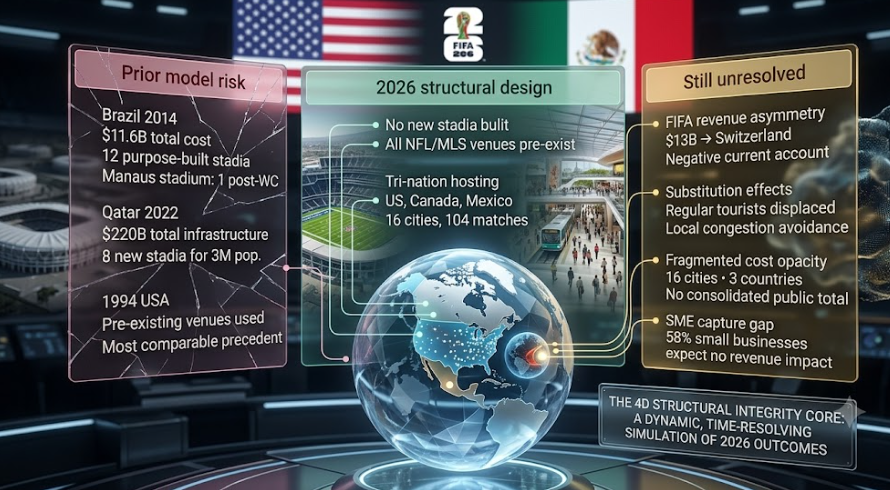
Every four years, the announcement of a FIFA World Cup host triggers a predictable cycle: ambitious economic projections, accelerating public investment, and, in the years after the final whistle, the quieter reckoning with what was actually built, spent, and retained. Brazil’s 2014 tournament cost an estimated $11.6 billion, much of it in federal and state funds. Qatar 2022 constructed an entirely new urban sporting infrastructure for a population base unable to sustain it post-tournament. Against this history, the structural design of the 2026 World Cup represents a genuine if partial departure.
For the first time in the tournament’s history, the 2026 edition is hosted jointly by three nations across a pre-existing sporting infrastructure. The United States’ 11 host cities use NFL and MLS stadiums already embedded in profitable professional sports ecosystems. Canada and Mexico similarly leverage established venues. FIFA did not require the construction of new stadiums — a defining feature of prior fiscal disasters. This structural choice fundamentally alters the fiscal risk profile of the 2026 tournament, but does not eliminate it.
The core analytical question this paper addresses is not whether the 2026 World Cup generates economic activity it clearly does but rather how that activity is distributed across actors, how reliably impact projections map to verified outcomes, and whether the public expenditures borne by host cities and their taxpayers are proportionate to the net benefits their communities actually receive. Early data from Bank of America’s consumer spending analysis, Allianz Trade’s macroeconomic forecasting, Natixis CIB’s GDP modelling, and field reporting from NPR, Forbes, and North Carolina State University provides an unusually rich real-time evidence base from which to begin that assessment.
2. The Projection Landscape: Record Numbers and Their Caveats
The headline economic projection for the 2026 World Cup is $40.9 billion in additional global GDP a figure widely cited across media, municipal planning documents, and infrastructure investment justifications. Disaggregated, the Allianz Trade analysis estimates $9.1 billion in GDP across North America for the June–July 2026 period, with $8 billion of that driven by tourism spending: $5.4 billion in the United States, $1.4 billion in Mexico, and $1.2 billion in Canada. FIFA projects $13 billion in commercial revenues for the 2023–2026 cycle exceeding any prior World Cup cycle with the majority flowing from broadcasting rights, corporate sponsorship, licensing, and direct ticket and hospitality revenues.
These are not trivial numbers. For context, Taylor Swift’s Eras Tour generated approximately $2.1 billion in revenue across 149 shows. The World Cup’s $8 billion tourism footprint in North America represents roughly four times the economic footprint of one of the highest-grossing concert tours in history, compressed into six weeks (Allianz Trade, 2026). The tournament is expected to mobilise 6.5 million attendees, including 2.6 million international visitors each spending on accommodation, food, transport, and retail in host cities.
However, academic economists are consistent in flagging a methodological problem endemic to mega-event economic impact studies: they systematically overstate benefits and understate costs. Professor Michael Edwards of North Carolina State University, whose research specialises in sport finance, identifies several structural biases: impact studies calculate total event-related spending and apply economic multipliers without accounting for substitution effects (tourists who displace regular visitors), crowding-out effects (local residents and non-football tourists who avoid host cities during the tournament), and income leakage (revenue captured by international hotel chains, FIFA’s Swiss-based corporate structure, and global broadcasting intermediaries rather than local economies). The 1994 World Cup in the United States the most directly comparable historical event produced verified economic benefits estimated by economists Robert Baade and Victor Matheson to fall between $5.5 billion and $9.3 billion short of initial projections.
3. The Distribution Problem: FIFA Wins, Host Cities Assume Risk
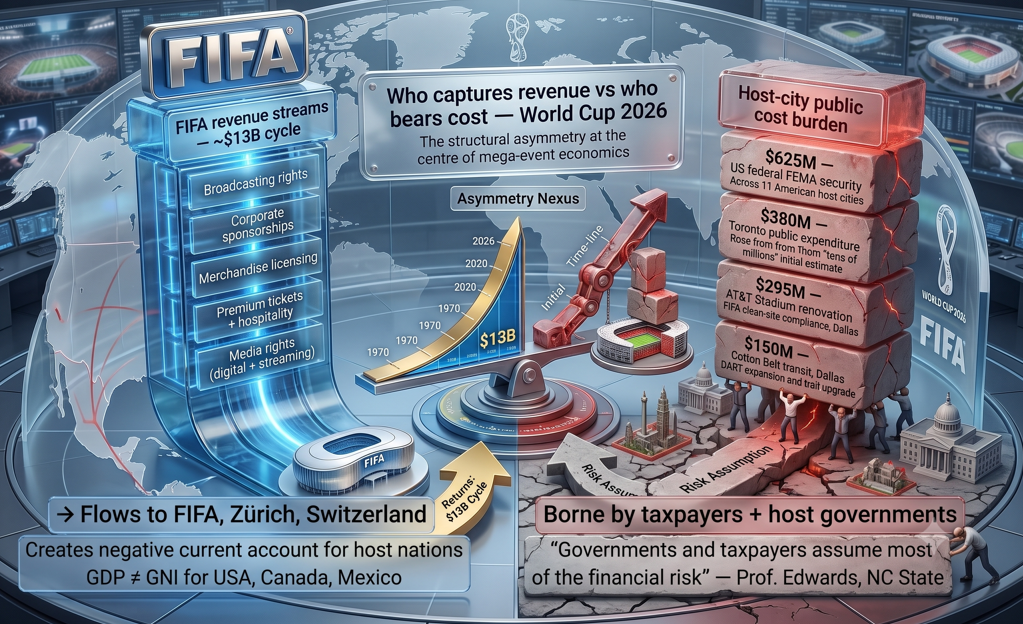
The most consistently documented structural feature of World Cup economics is a fundamental asymmetry in who captures revenue versus who bears cost. FIFA, as tournament organiser, controls the most scalable and valuable revenue streams: broadcasting rights sold to global media networks, corporate sponsorships with multinational brands, merchandise licensing, and premium ticket and hospitality packages. FIFA projects revenue of approximately $11 billion from the 2026 tournament directly, with total 2023–2026 cycle revenues reaching $13 billion. As a Switzerland-registered non-profit, FIFA’s revenues do not accrue to the GDP of host nations the transfer of income toward its Swiss accounts represents a negative net current account flow for the United States, Canada, and Mexico (Allianz Trade, 2026).
Host cities, conversely, bear the tournament’s most visible and durable costs: venue modifications, municipal service expansions, security deployments, transit upgrades, and planning infrastructure. In the United States, FEMA awarded $625 million in security funding to the 11 host cities a federal subsidy that represents a direct public cost independent of any tournament revenue (Britannica, 2026). Toronto’s projected hosting costs rose from tens of millions to approximately $380 million (Britannica, 2026). AT&T Stadium in Dallas required a $295 million upgrade including field widening, turf replacement, and temporary FIFA-compliant rebranding. Even host cities that received assurances that costs would be covered by private backers faced public pressure: Foxborough, Massachusetts, raised approximately $7.8 million for public safety at Gillette Stadium, eventually secured from Kraft Sports & Entertainment only after local taxpayers explicitly refused to subsidise it.
Professor Edwards is direct on the structural consequence: ‘Governments and taxpayers assume much of the financial risk’ while FIFA and its commercial network including global sponsors and broadcasters capture the majority of financial benefit. This is not a new observation, but the 2026 tournament’s distributed model raises a specific additional concern: because the event is spread across 16 cities in three countries, the costs are also distributed potentially obscuring the aggregate public burden by fragmenting it across multiple jurisdictions and budget cycles.
4. What the Verified Early Data Shows
Unlike the post-event analyses that typically reveal the gap between projection and reality, the 2026 World Cup provides an unusually rich stream of real-time economic data during the tournament itself. Bank of America’s consumer spending analysis tracking card-based purchases in all 16 host cities found that overall spending increased 6.3% year-over-year during the tournament’s early weeks, with non-local visitor spending up a striking 16.7% compared to the same period in 2025 (Forbes, June 2026). Hotels, restaurants, entertainment venues, and transit operators in host cities are experiencing measurable and attributable demand surges.
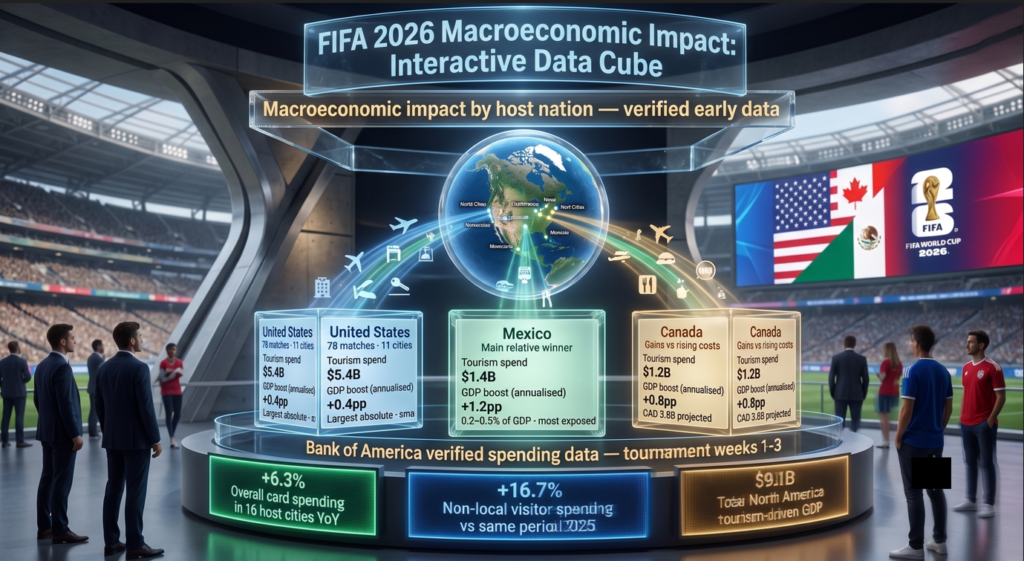
At the macroeconomic level, Natixis CIB modelling translates the tournament into quarterly GDP effects: a boost of +0.1 percentage points (non-annualised) above a no-World-Cup counterfactual for the United States, +0.3 percentage points for Mexico, and +0.2 percentage points for Canada. Expressed in annualised terms: +0.4% for the US, +1.2% for Mexico, and +0.8% for Canada. Mexico emerges as the proportionally largest beneficiary its economy is more exposed to tourism and services, meaning the international visitor influx has a more visible aggregate impact relative to GDP. Mexico’s absolute economic benefit is estimated at approximately $3 billion, representing between 0.2% and 0.5% of GDP (Saxo, 2026). Canada projects CAD 3.8 billion in benefits, though these must be weighed against the public expenditure burden for which no comprehensive consolidated figure has yet been published.
Several complicating factors moderate the optimistic early data. Hotel bookings in some US host cities reportedly came in below expectations ahead of the tournament. International tourism to the United States softened generally across 2025, and high ticket prices and travel costs constrained attendance from lower-income fan communities and smaller footballing nations. FIFA’s own projection that 40% of attendees would be international fans has been questioned by sports event researchers, with Professor Heere a specialist in international sports events stating publicly that ‘40% seems like a lot.’ Visa restrictions and travel advisories affecting several qualifying nations further reduced the potential international attendance base.
5. Small Business Access and Distributional Equity
One of the most under-examined dimensions of mega-event economics is the distributional question within host communities specifically, whether local and small businesses can actually capture the consumer spending that international visitors bring. Research conducted in Canadian host cities ahead of the tournament found that 64% of small businesses expected a positive impact, and 41% anticipated revenue increases of 20% or more. These expectations, however, collided with a stark operational reality: 58% of small business owners expected no revenue impact compared to a typical summer, citing rising operating costs, tight margins, and insufficient preparation time and resources (Supplier.io, 2026).
The 2026 tournament introduced formal Local Impact Supplier Programs in several US host cities Miami, Dallas, Los Angeles, and Boston all created registration programmes connecting certified local and diverse-owned businesses to FIFA procurement processes. This structural innovation represents a meaningful effort to route event-related spending toward community economic actors, rather than allowing it to be captured entirely by national hotel chains, international food service corporations, and global merchandise distributors. Whether these programmes delivered proportionate benefit at scale remains a critical unanswered question that post-event analysis will need to address.
Even within the hospitality sector nominally among the biggest beneficiaries the distributional picture is uneven. Professor Edwards notes that hotels, restaurants, and entertainment businesses can often charge premium rates and boost profits during major events, while workers’ wages typically remain largely unchanged. Congestion effects and premium pricing during the tournament may also deter regular visitors and local residents, redistributing consumption rather than creating net new economic activity. This substitution effect is structurally invisible in multiplier-based impact studies that measure total spending rather than net spending.
6. Legacy Infrastructure: The 2026 Model as a Structural Improvement
The 2026 World Cup represents a deliberate institutional response to the white-elephant problem that damaged the reputations of Brazil 2014 and Qatar 2022. By hosting exclusively in pre-existing, commercially active venues all operating within profitable professional sports franchises FIFA eliminated the single largest source of long-term fiscal damage in prior tournaments: the construction and subsequent under-utilisation of purpose-built stadia. The risk of billion-dollar sporting infrastructure sitting underused in cities without the population base or sporting culture to sustain it is structurally absent from the 2026 model.
The legacy investments that did occur transit improvements, fan-zone public space upgrades, hotel expansion, and telecommunications infrastructure are more likely to generate durable community benefit than stadium construction, because they serve general population needs rather than event-specific requirements. Dallas’s Cotton Belt multiuse trail ($150 million) and DART expansion, for example, will serve the Dallas metropolitan region long after the World Cup concludes. These are genuine public goods, financed in part under the tournament’s umbrella, though the counterfactual question — would these investments have occurred without the World Cup remains analytically open.
The tournament’s ‘validation effect’ the term used by SMU economics professor Cullum Clark to describe how hosting a major international event signals a city’s global status to corporate relocation decision-makers is real but difficult to quantify. Dallas, Atlanta, Miami, and Los Angeles all positioned World Cup hosting as part of a broader corporate attraction strategy. Whether this brand-building translates to measurable long-run investment flows above the counterfactual remains an empirical question that will require five-to-ten year longitudinal analysis to answer rigorously.
7. Conclusion: A Better Model, Not a Resolved Problem
The 2026 FIFA World Cup is generating real, measurable, and early-verified economic activity. Bank of America’s 16.7% non-local visitor spending surge is not noise it reflects genuine consumer behaviour in host cities. Mexico’s +1.2% annualised GDP boost is proportionally significant for an economy its size. The pre-existing infrastructure model avoids the fiscal catastrophes of prior tournaments, and the Local Impact Supplier Programs represent a structural innovation in distributional intent, if not yet verified distributional outcome.
But the fundamental asymmetry that has characterised World Cup economics for decades has not been resolved by the 2026 model. FIFA controls the most scalable revenue streams broadcasting, sponsorship, licensing and captures them through a Switzerland-based non-profit structure that creates no GDP or tax revenue for host nations. Host cities and their taxpayers bear the security costs, transit costs, venue modification costs, and planning costs with $625 million in US federal security funding alone representing a public subsidy that will not appear in any FIFA profit-and-loss account. The $40.9 billion headline GDP projection must be understood as a gross figure that does not net out substitution effects, income leakage, crowding-out, or public expenditure burdens.
The 2026 World Cup is a better model than its predecessors more fiscally responsible, more geographically distributed, and more structurally attentive to small-business inclusion. But ‘better than Qatar’ is a low bar. The more demanding standard whether the public investment of host cities produces proportionate, durable, and equitably distributed net benefit for their residents remains an open question that honest post-tournament analysis will need to answer without the glow of the spectacle to distract from the arithmetic.